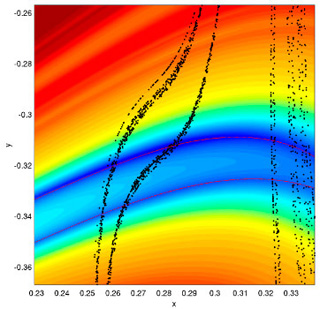
Structure of the stable manifold for a two-dimensional, chaotic map. Black dots are points on the model attractor and red line is the local structure of the stable manifold - all points on the stable manifold collapse to the same point as they are integrated forward in time. The colors are a representation of the distance between a point in the space and a specified model trajectory. Note that the stable manifold lies in the minimum of this cost function space. (Courtesy of Prof. Jim Hansen.)
Instructor(s)
Prof. Jim Hansen
MIT Course Number
12.990
As Taught In
Spring 2003
Level
Graduate
Course Description
Course Description
Forecasting is the ultimate form of model validation. But even if a perfect model is in hand, imperfect forecasts are likely. This course will cover the factors that limit our ability to produce good forecasts, will show how the quality of forecasts can be gauged a priori (predicting our ability to predict!), and will cover the state of the art in operational atmosphere and ocean forecasting systems.


