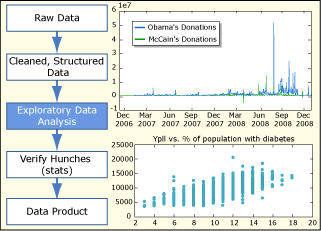
Two examples of exploratory data analysis: campaign contributions and county health rankings. (Image by the course instructors.)
Resource Description
Resource Features
Course Description
This course is an introduction to data cleaning, analysis and visualization. We will teach the basics of data analysis through concrete examples. You will learn how to take raw data, extract meaningful information, use statistical tools, and make visualizations.
This was offered as a non-credit course during the Independent Activities Period (IAP), which is a special 4-week term at MIT that runs from the first week of January until the end of the month.


